class: center, middle, inverse, title-slide # Lesson 3: Interactivity in Visual Analytics ### Dr. Kam Tin Seong<br/>Assoc. Professor of Information Systems (Practice) ### School of Computing and Information Systems,<br/>Singapore Management University ### 2020/02/1 (updated: 2022-04-28) --- ## What will you learn from this lesson? .large[ - Typology of Interactive Techniques - Data & view specification - View Manipulation - Process and Provenance - Interactive Design Primitive - Animation: Principles and Best Practices ] --- ## Building Block of Visual Analytics .center[ 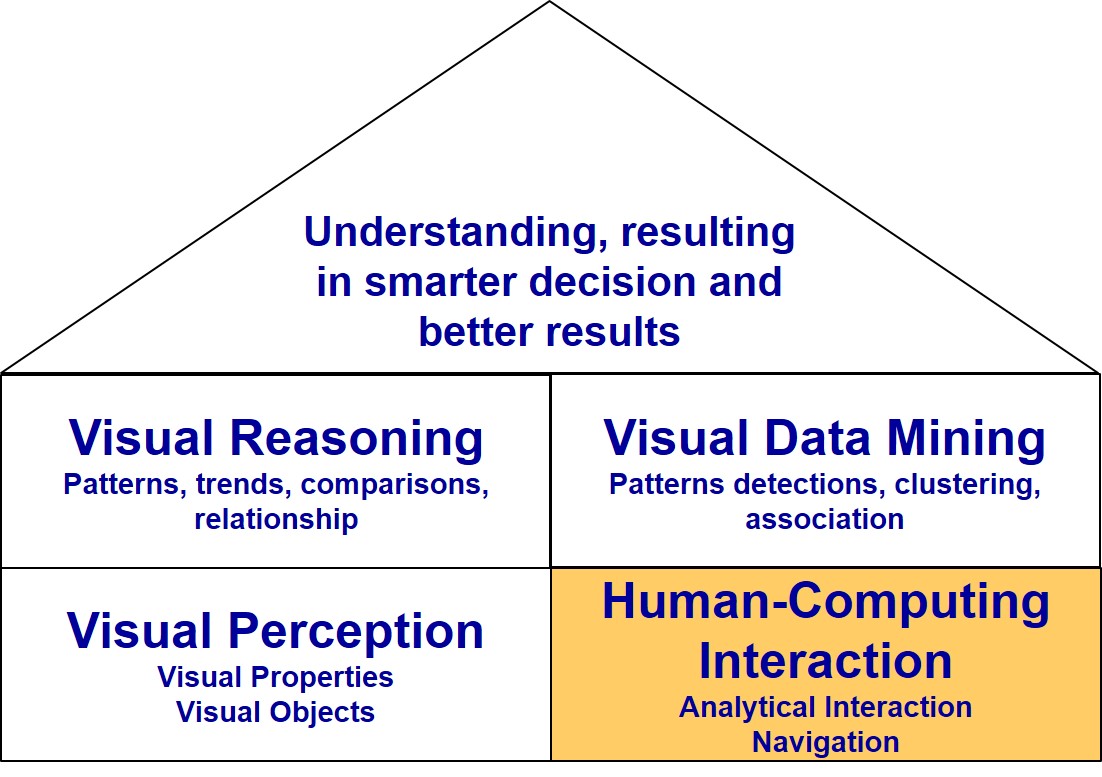] --- ## Revisiting Visual Analytics Framework .center[ 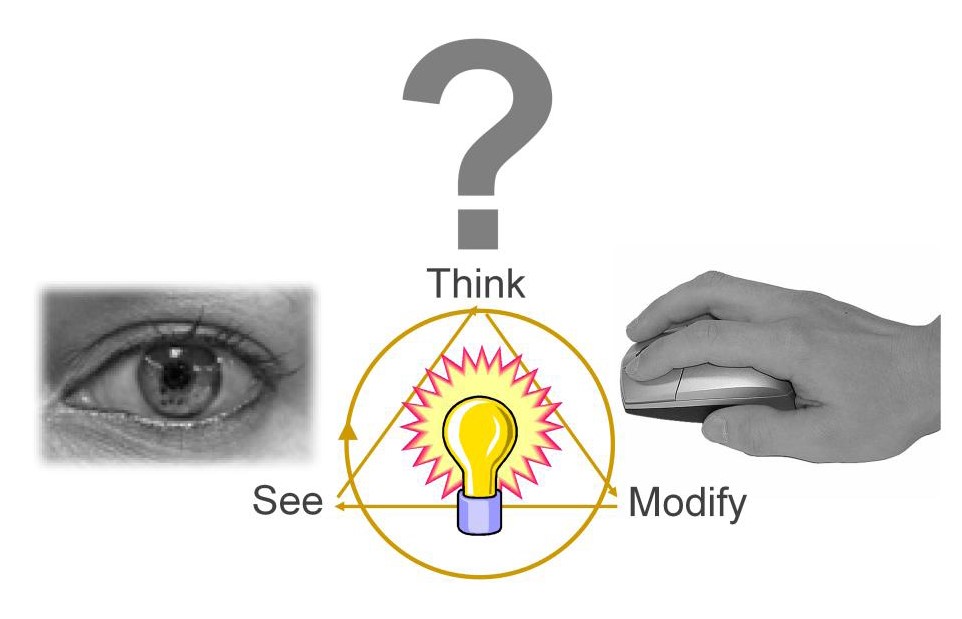] --- ## Taxonomy of Interactive Dynamics .center[ 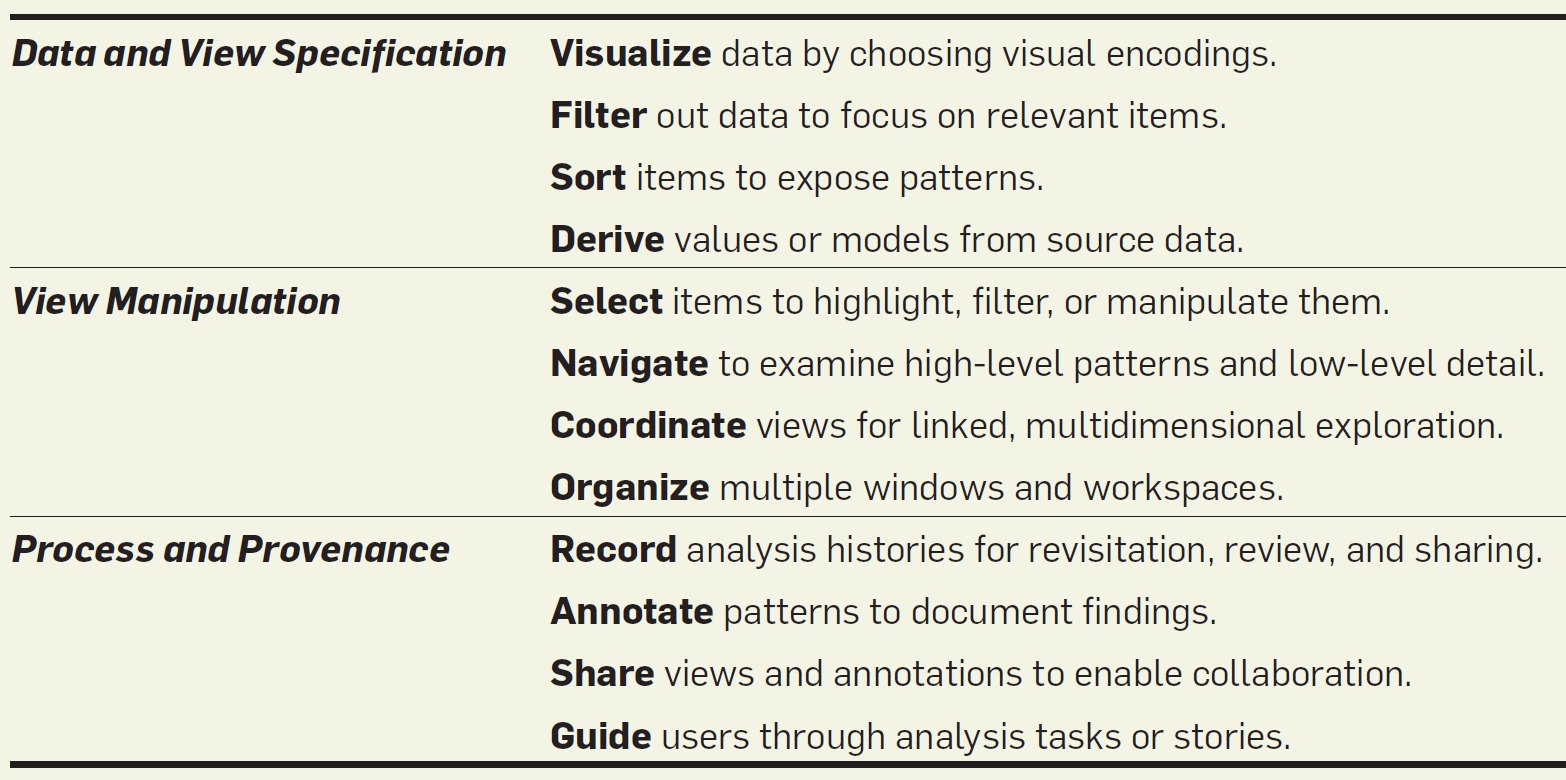] .small[ Source: Heer, J. & Shneiderman, B. (2012) "[Interactive Dynamics for Visual Analytics](https://queue.acm.org/detail.cfm?id=2146416)" ***ACM Queue***, Vol. 55, No. 4, pp 45-54.] --- ### Data & view specification - **Visualise** data by choosing visual encodings. - **Polaris** of Tableau .center[ 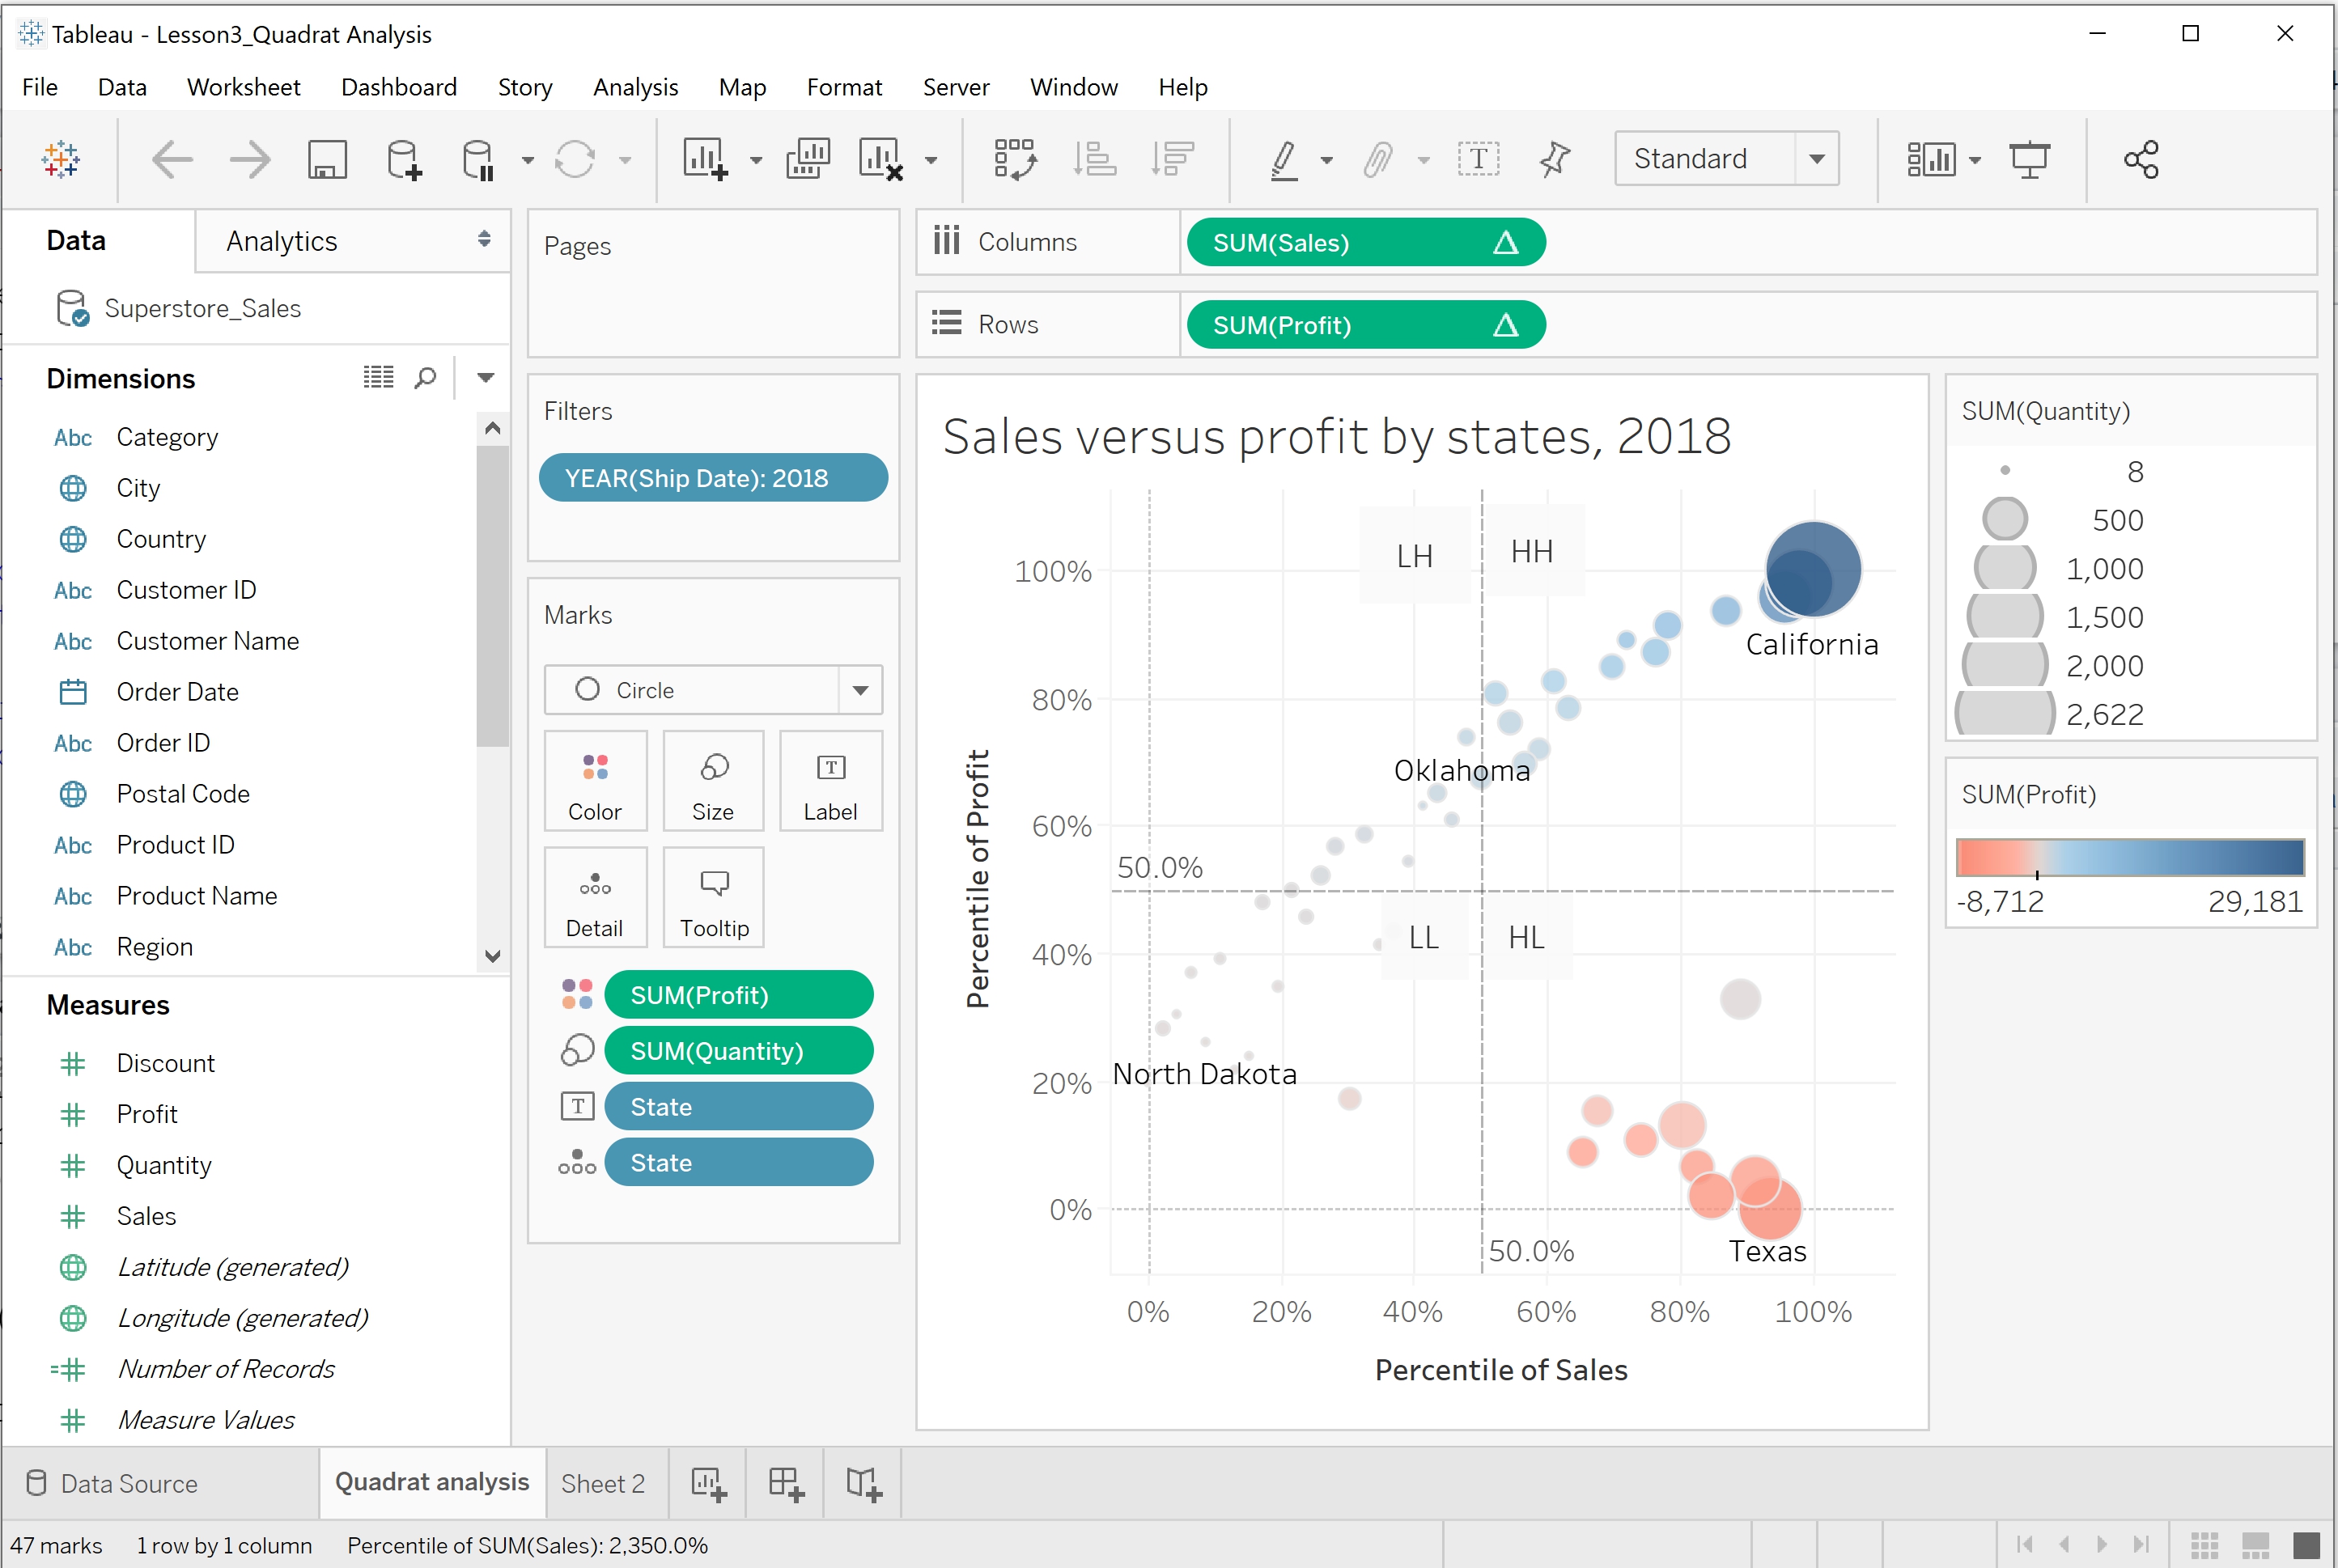] --- ### Data & view specification - **Filter** out data to focus on relevant items. .center[ 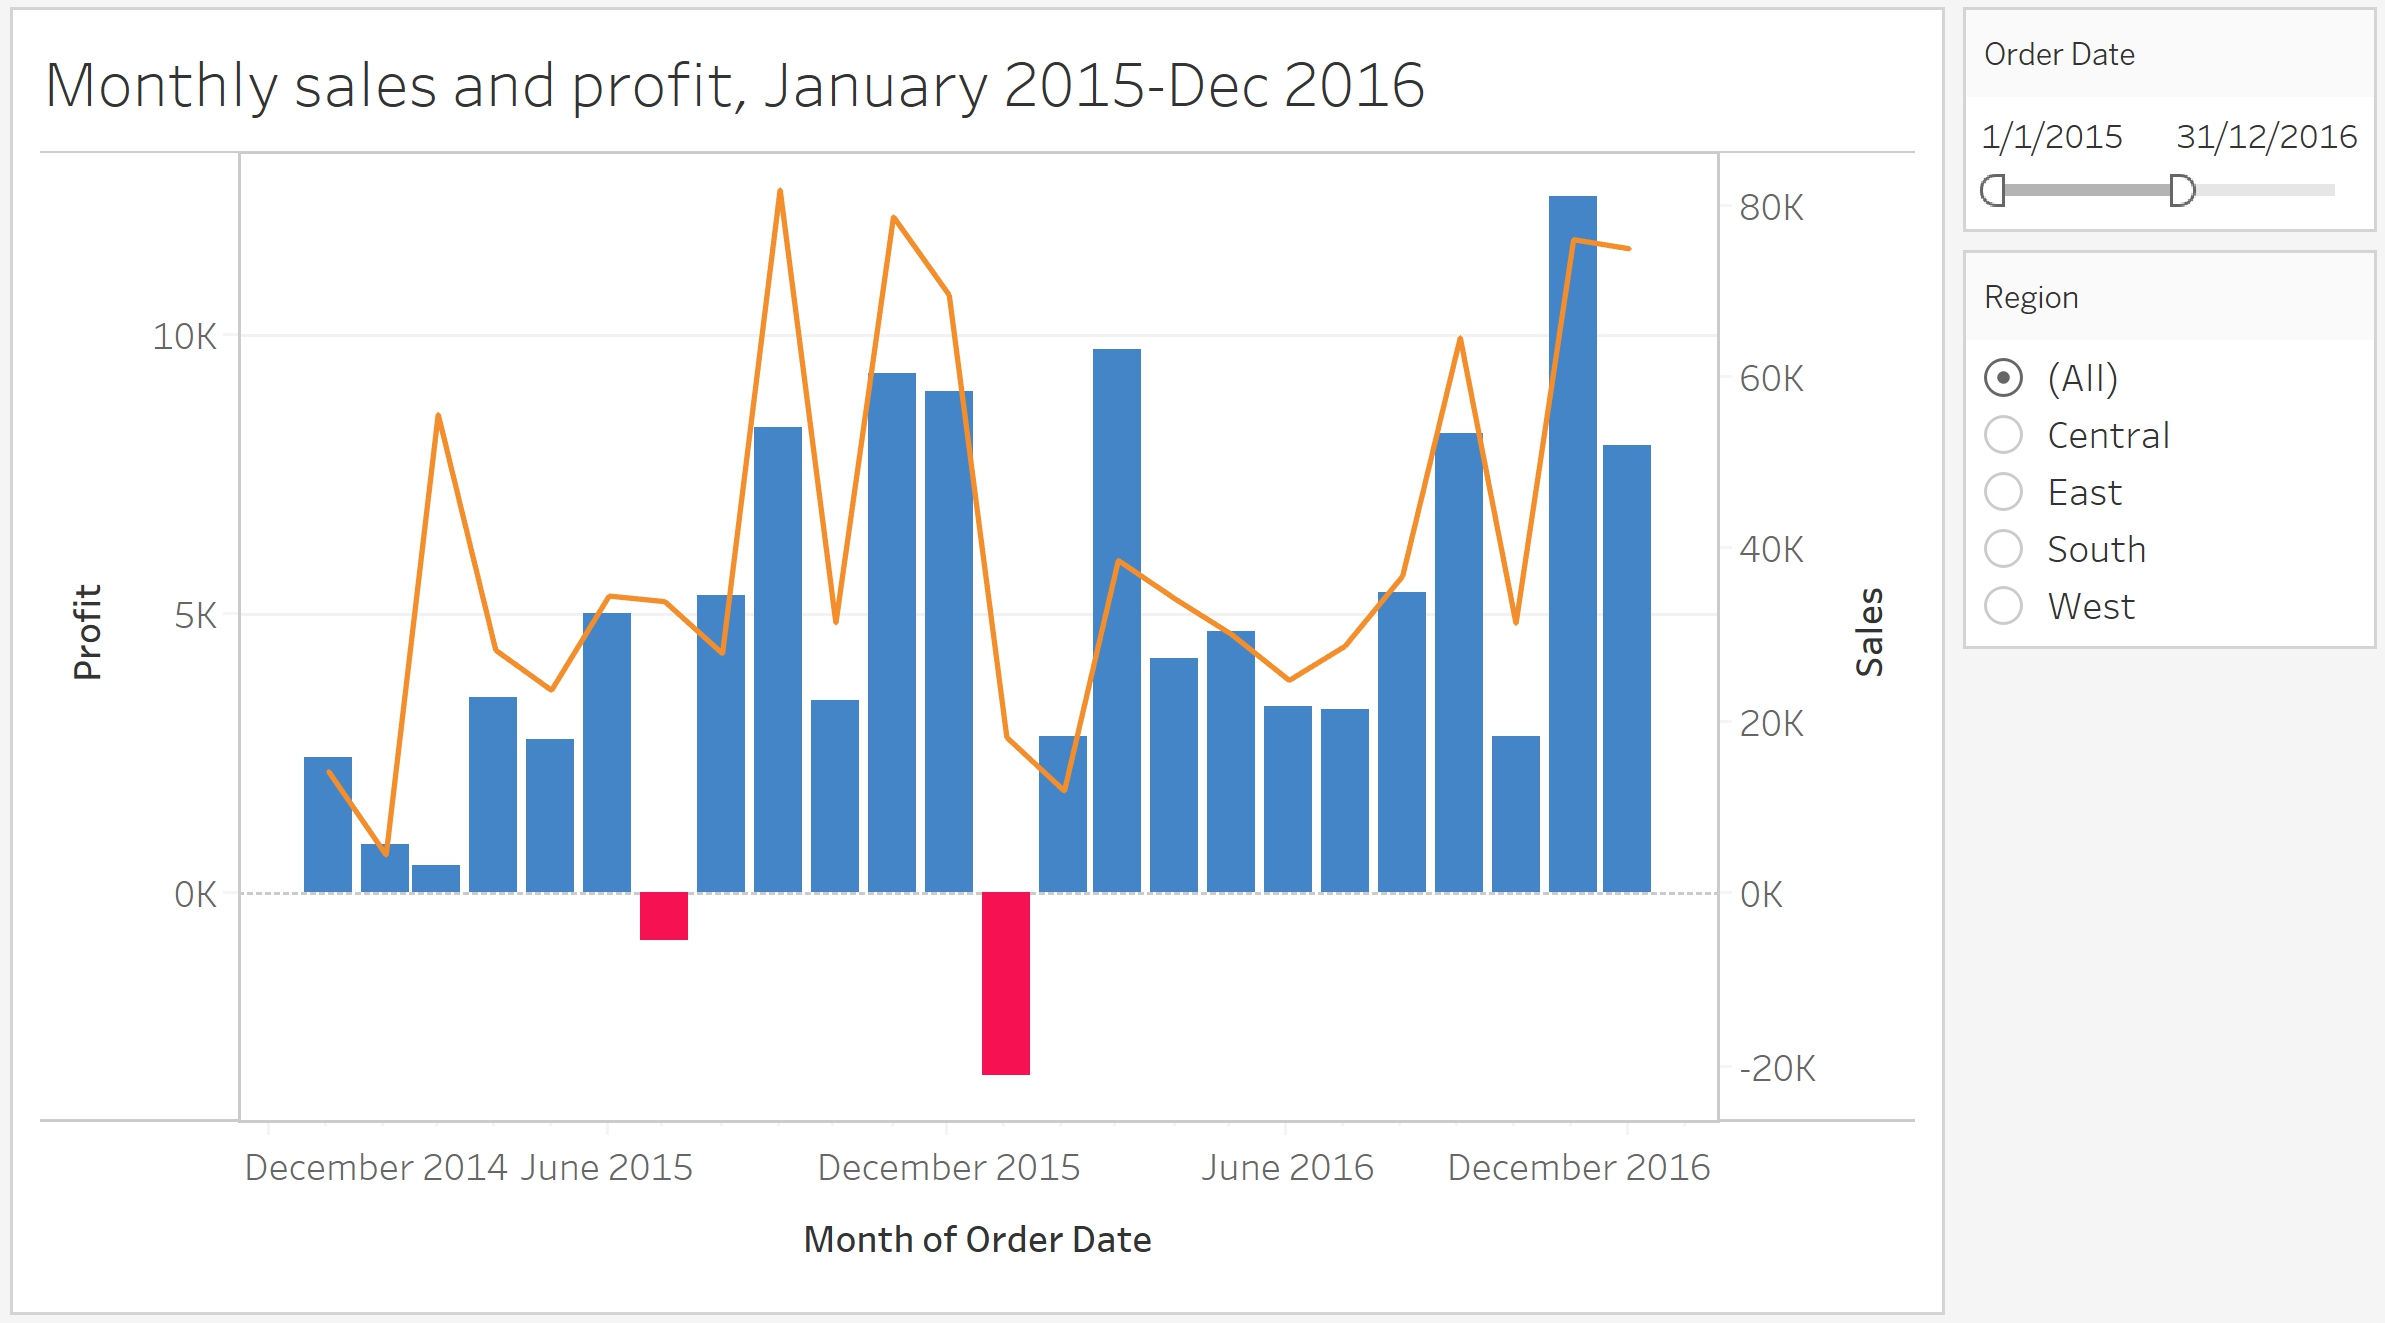] --- ### Data & view specification - **Slicer** is an axis-parallel selection tool, which selects a range along an axis, where the end-point of the interval can be modified dynamically. .center[ 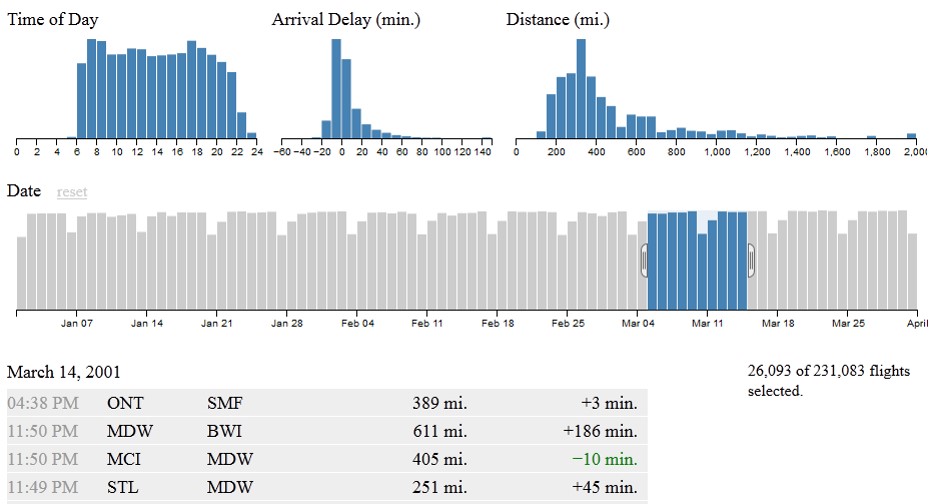] .small[Source: https://square.github.io/crossfilter/] --- ### Data & view specification - **Sort** items to expose patterns. .center[ 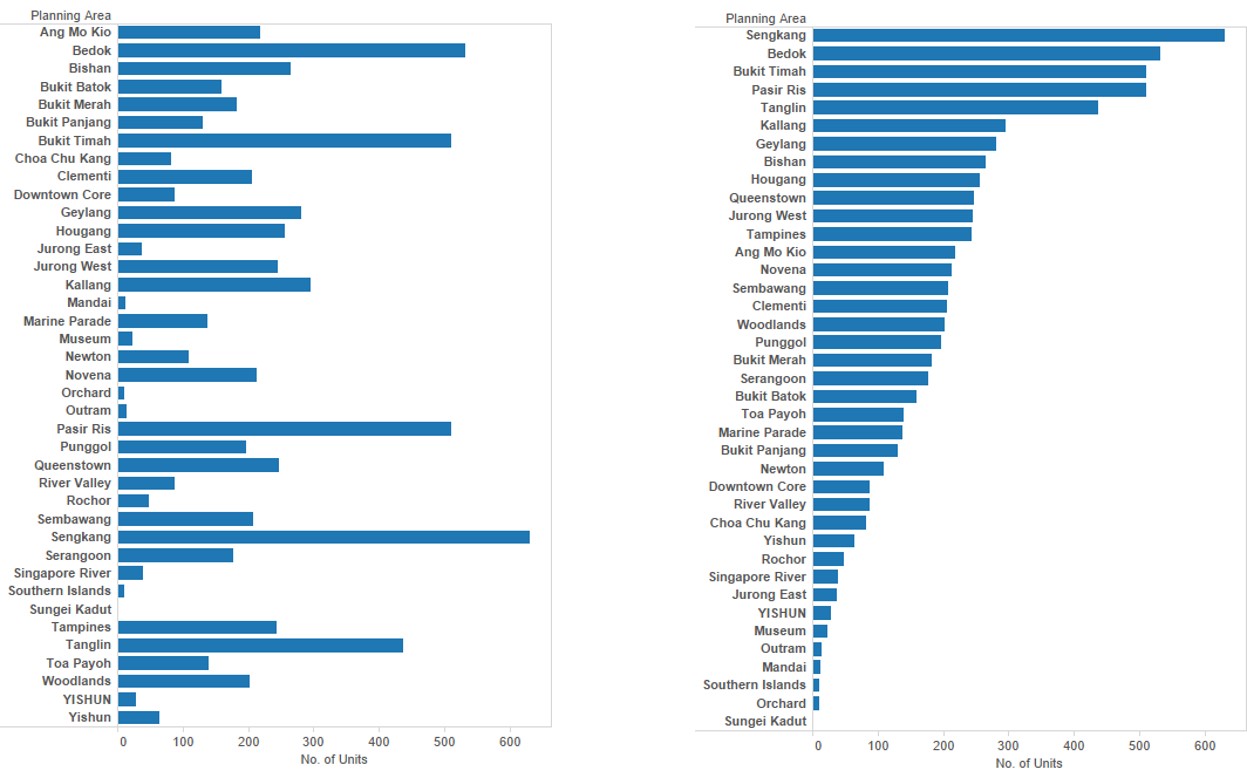] --- ### Data & view specification - Hierarchical sorting .center[ 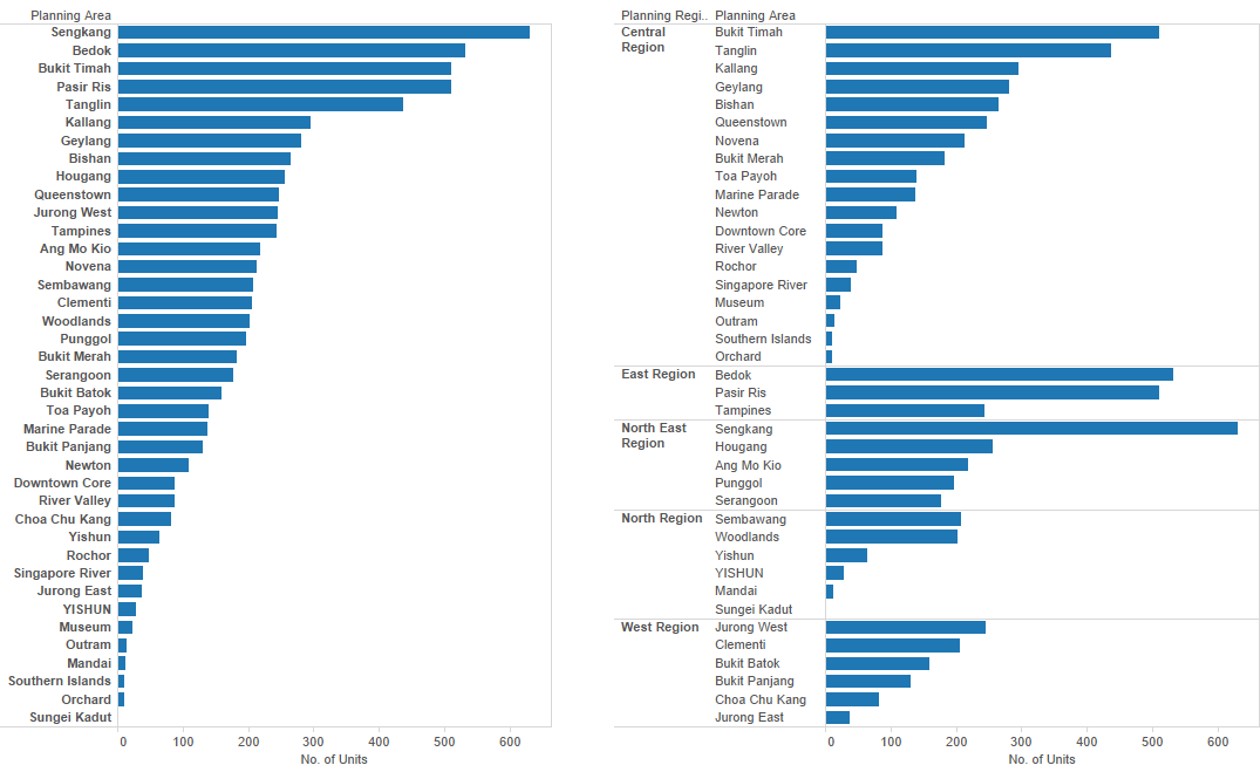] --- ### Data & view specification - **Derive** values or models from source data. .center[ 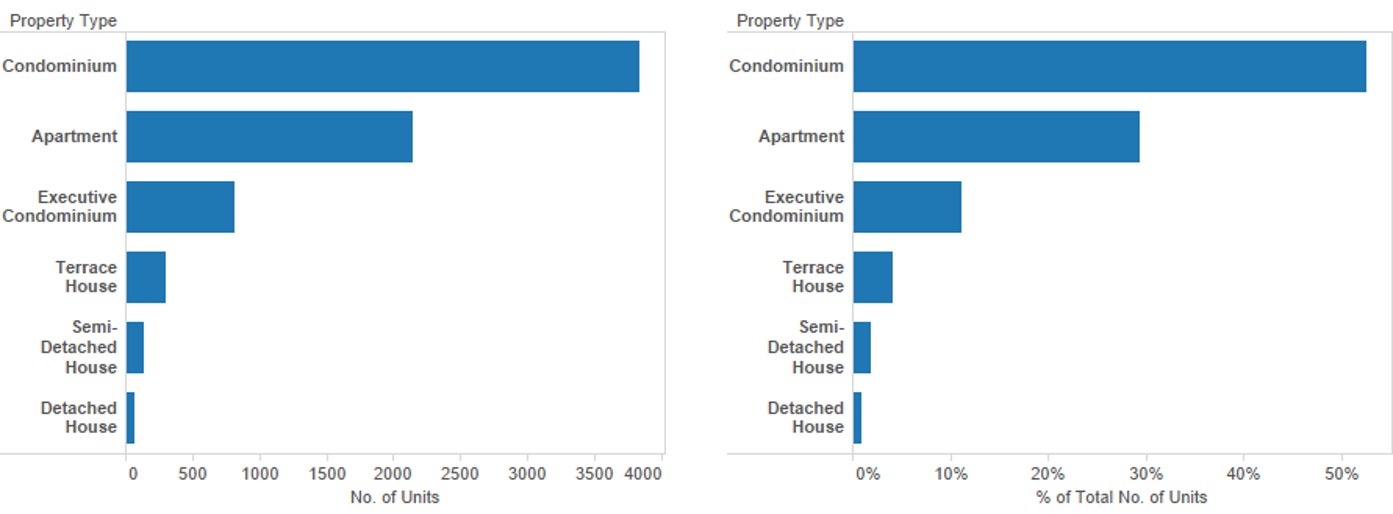] --- ## View Manipulation ### Selection functions - **Pointer** selects a single object in a plot. .center[ 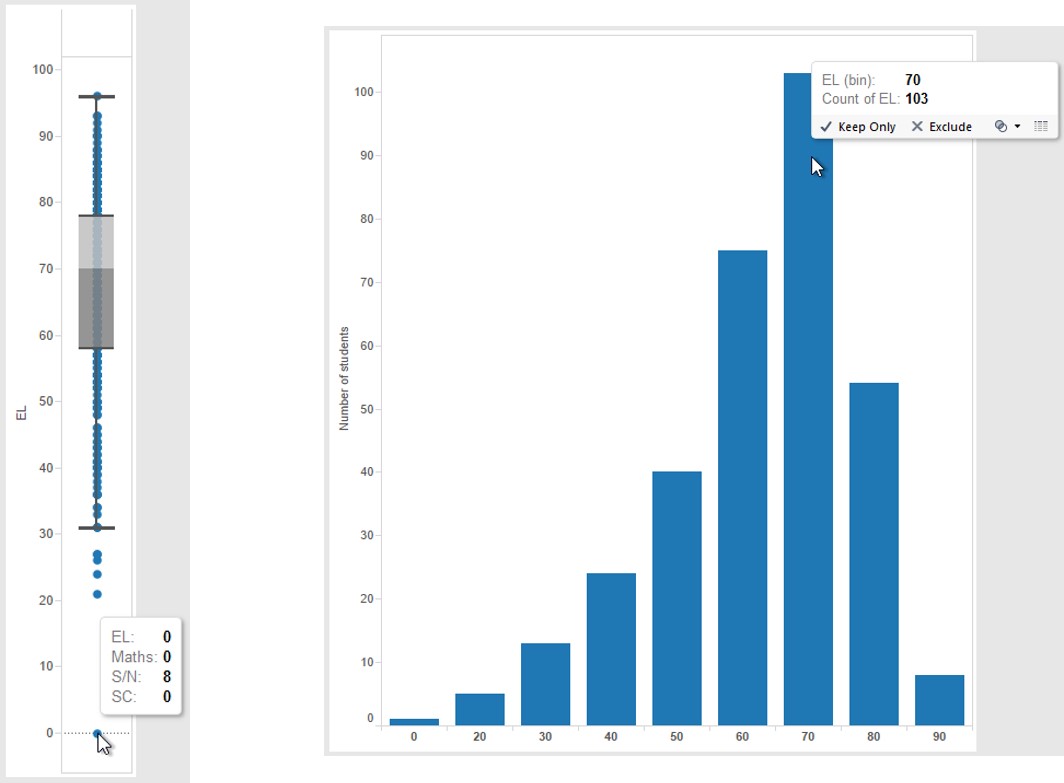] --- ## View Manipulation ### Selection functions - **Drag-box** selects a rectangular region in a box. .center[ 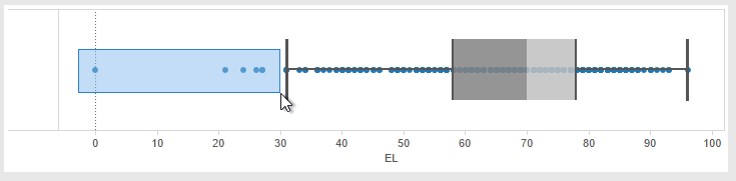] --- ## View Manipulation ### Selection functions .pull-left[ - **Brush** is a generalisation of the drag-box. Once a rectangular region is define, the brush allows users to move that region across a plot and thus dynamically change the selected subset. ] .pull-right[ 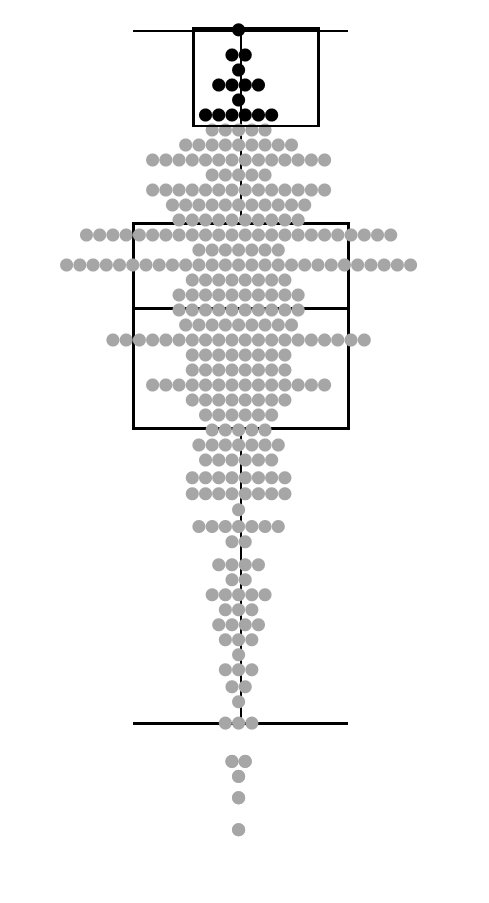] --- ## View Manipulation ### Selection functions - **Lasso** allows users to define an arbitrary contiguous shape to select data. .center[ ] --- ## View Manipulation ### Selection modes .center[ ] .small[ Reference: http://www.theusrus.de/Mondrian/] --- ## View Manipulation ### Highlighting - Selected records are highlighted. .center[ ] --- ## View Manipulation - **Navigate** to examine high-level patterns and low-level detail. - Shneiderman’s mantra .center[ ] --- ## View Manipulation - The scatter plot provides an overview and the bar and line graphs provide detail sales and profits trends overtime. .center[ 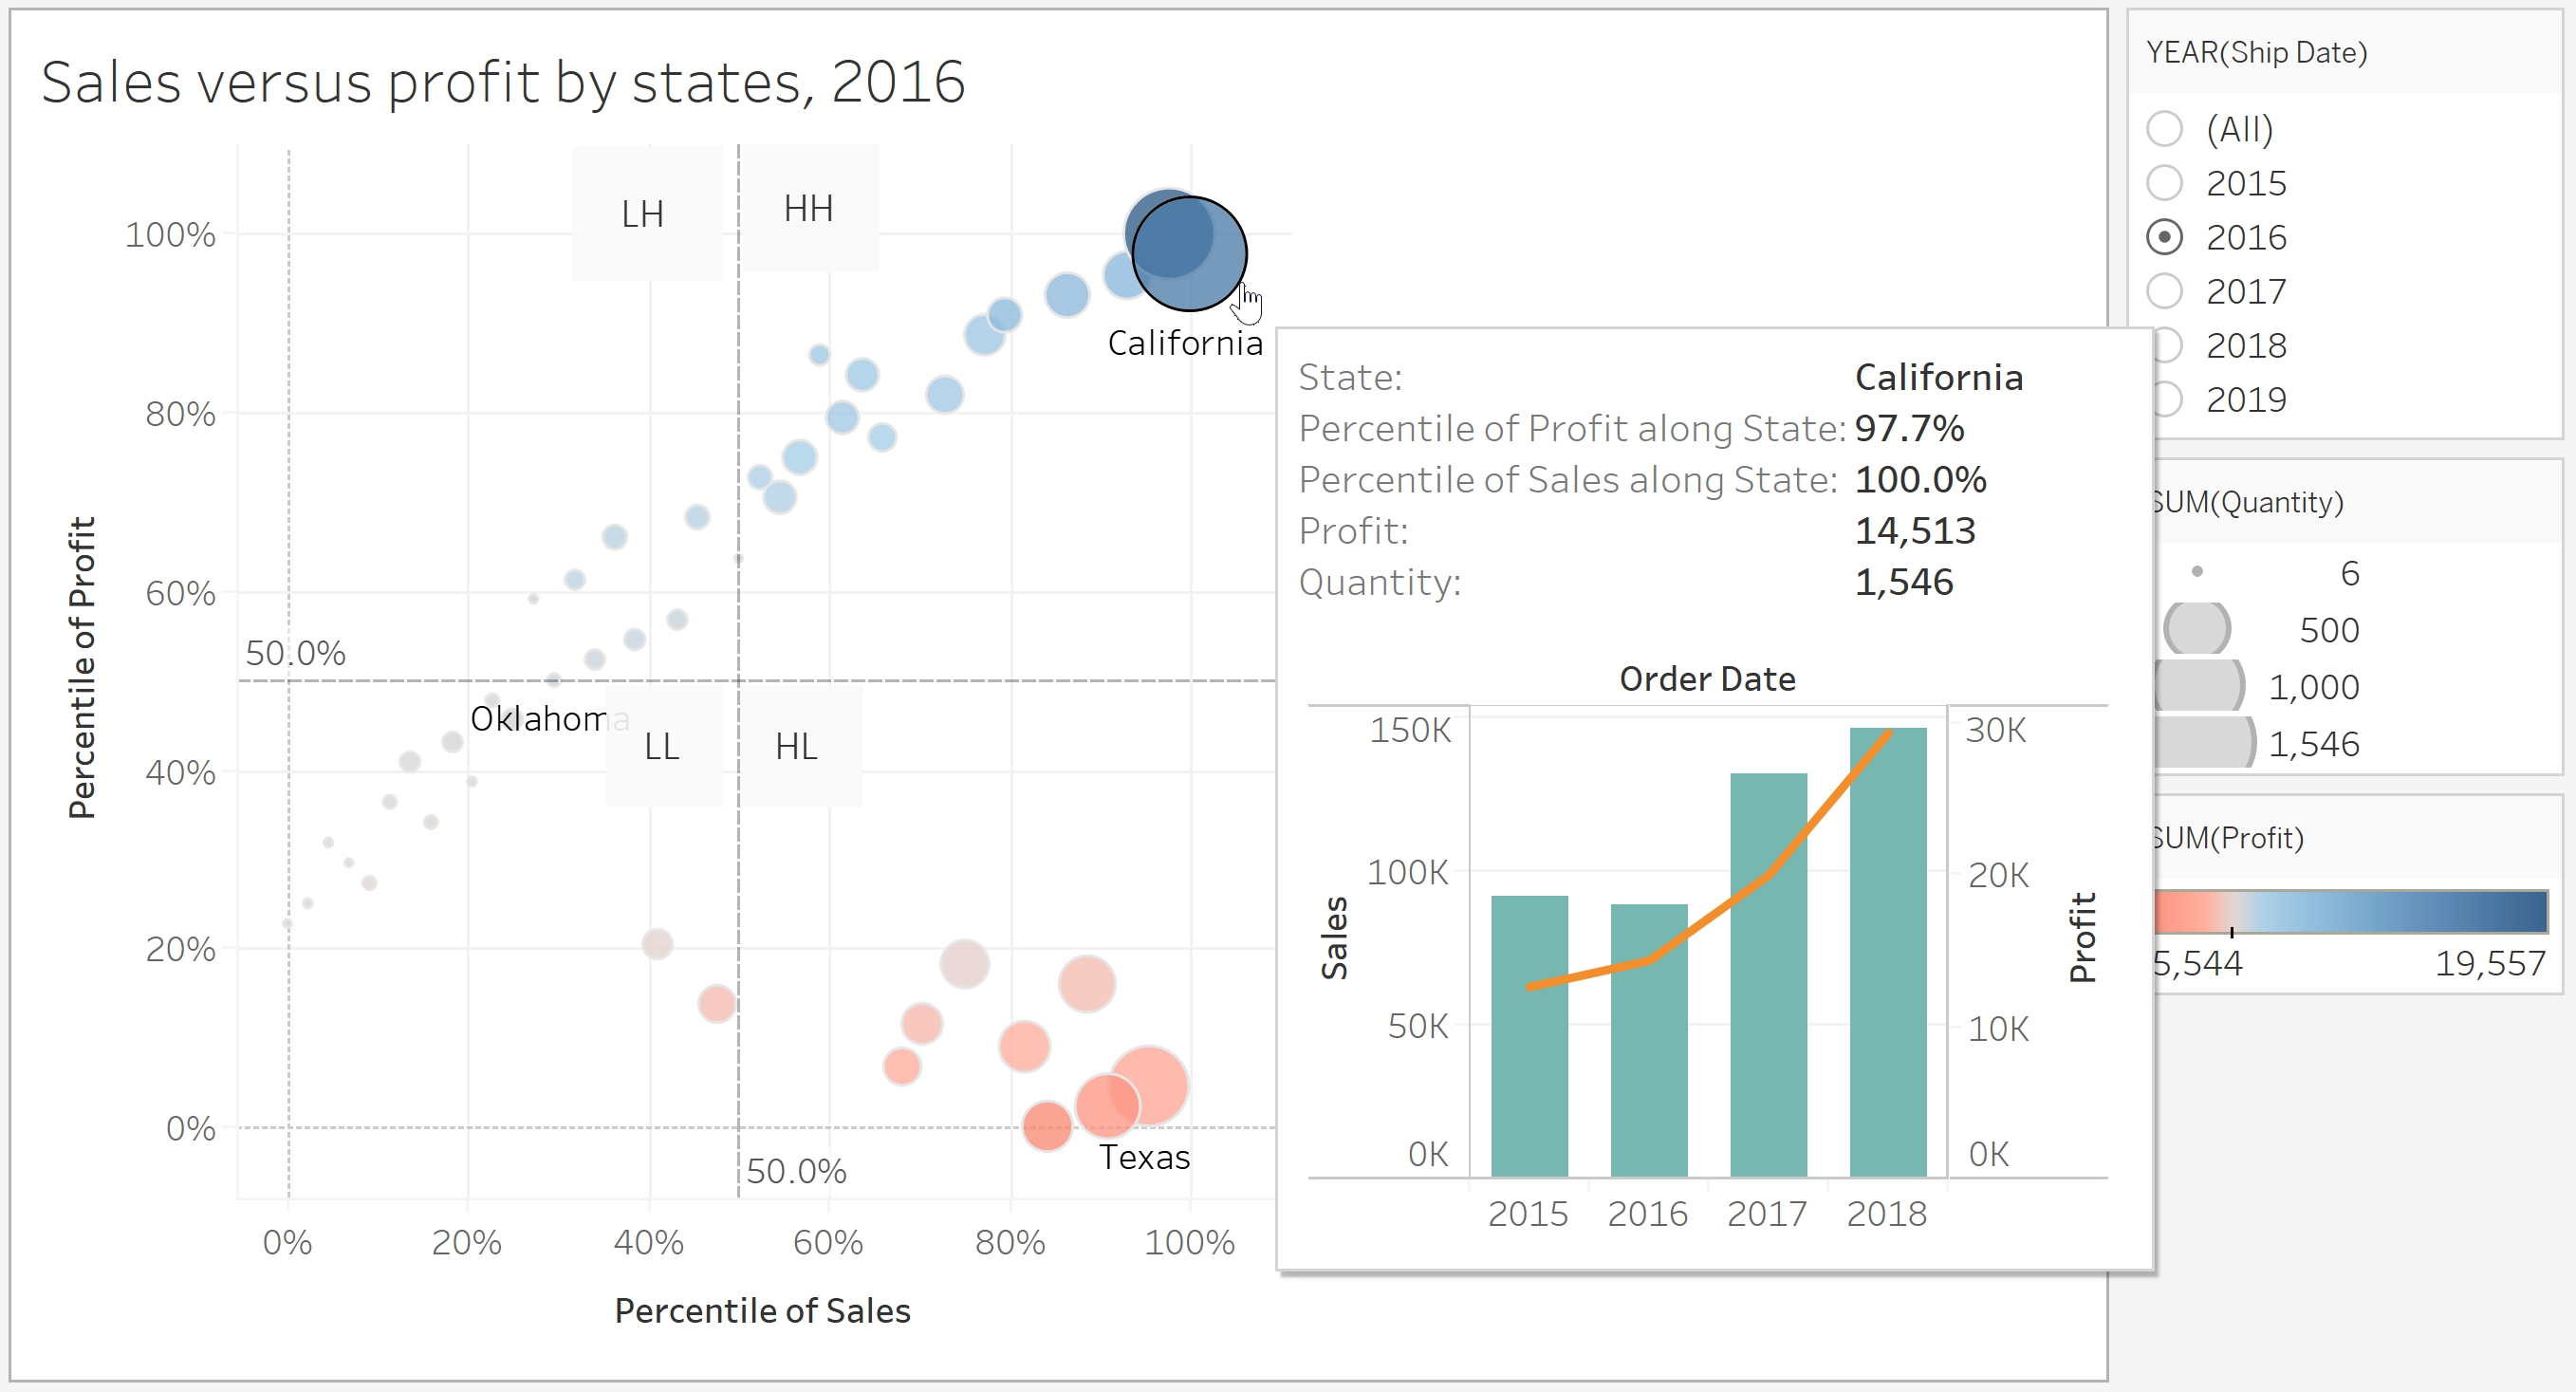] --- ## View Manipulation - **Coordinate** views for linked, multi-dimensional exploration .center[ 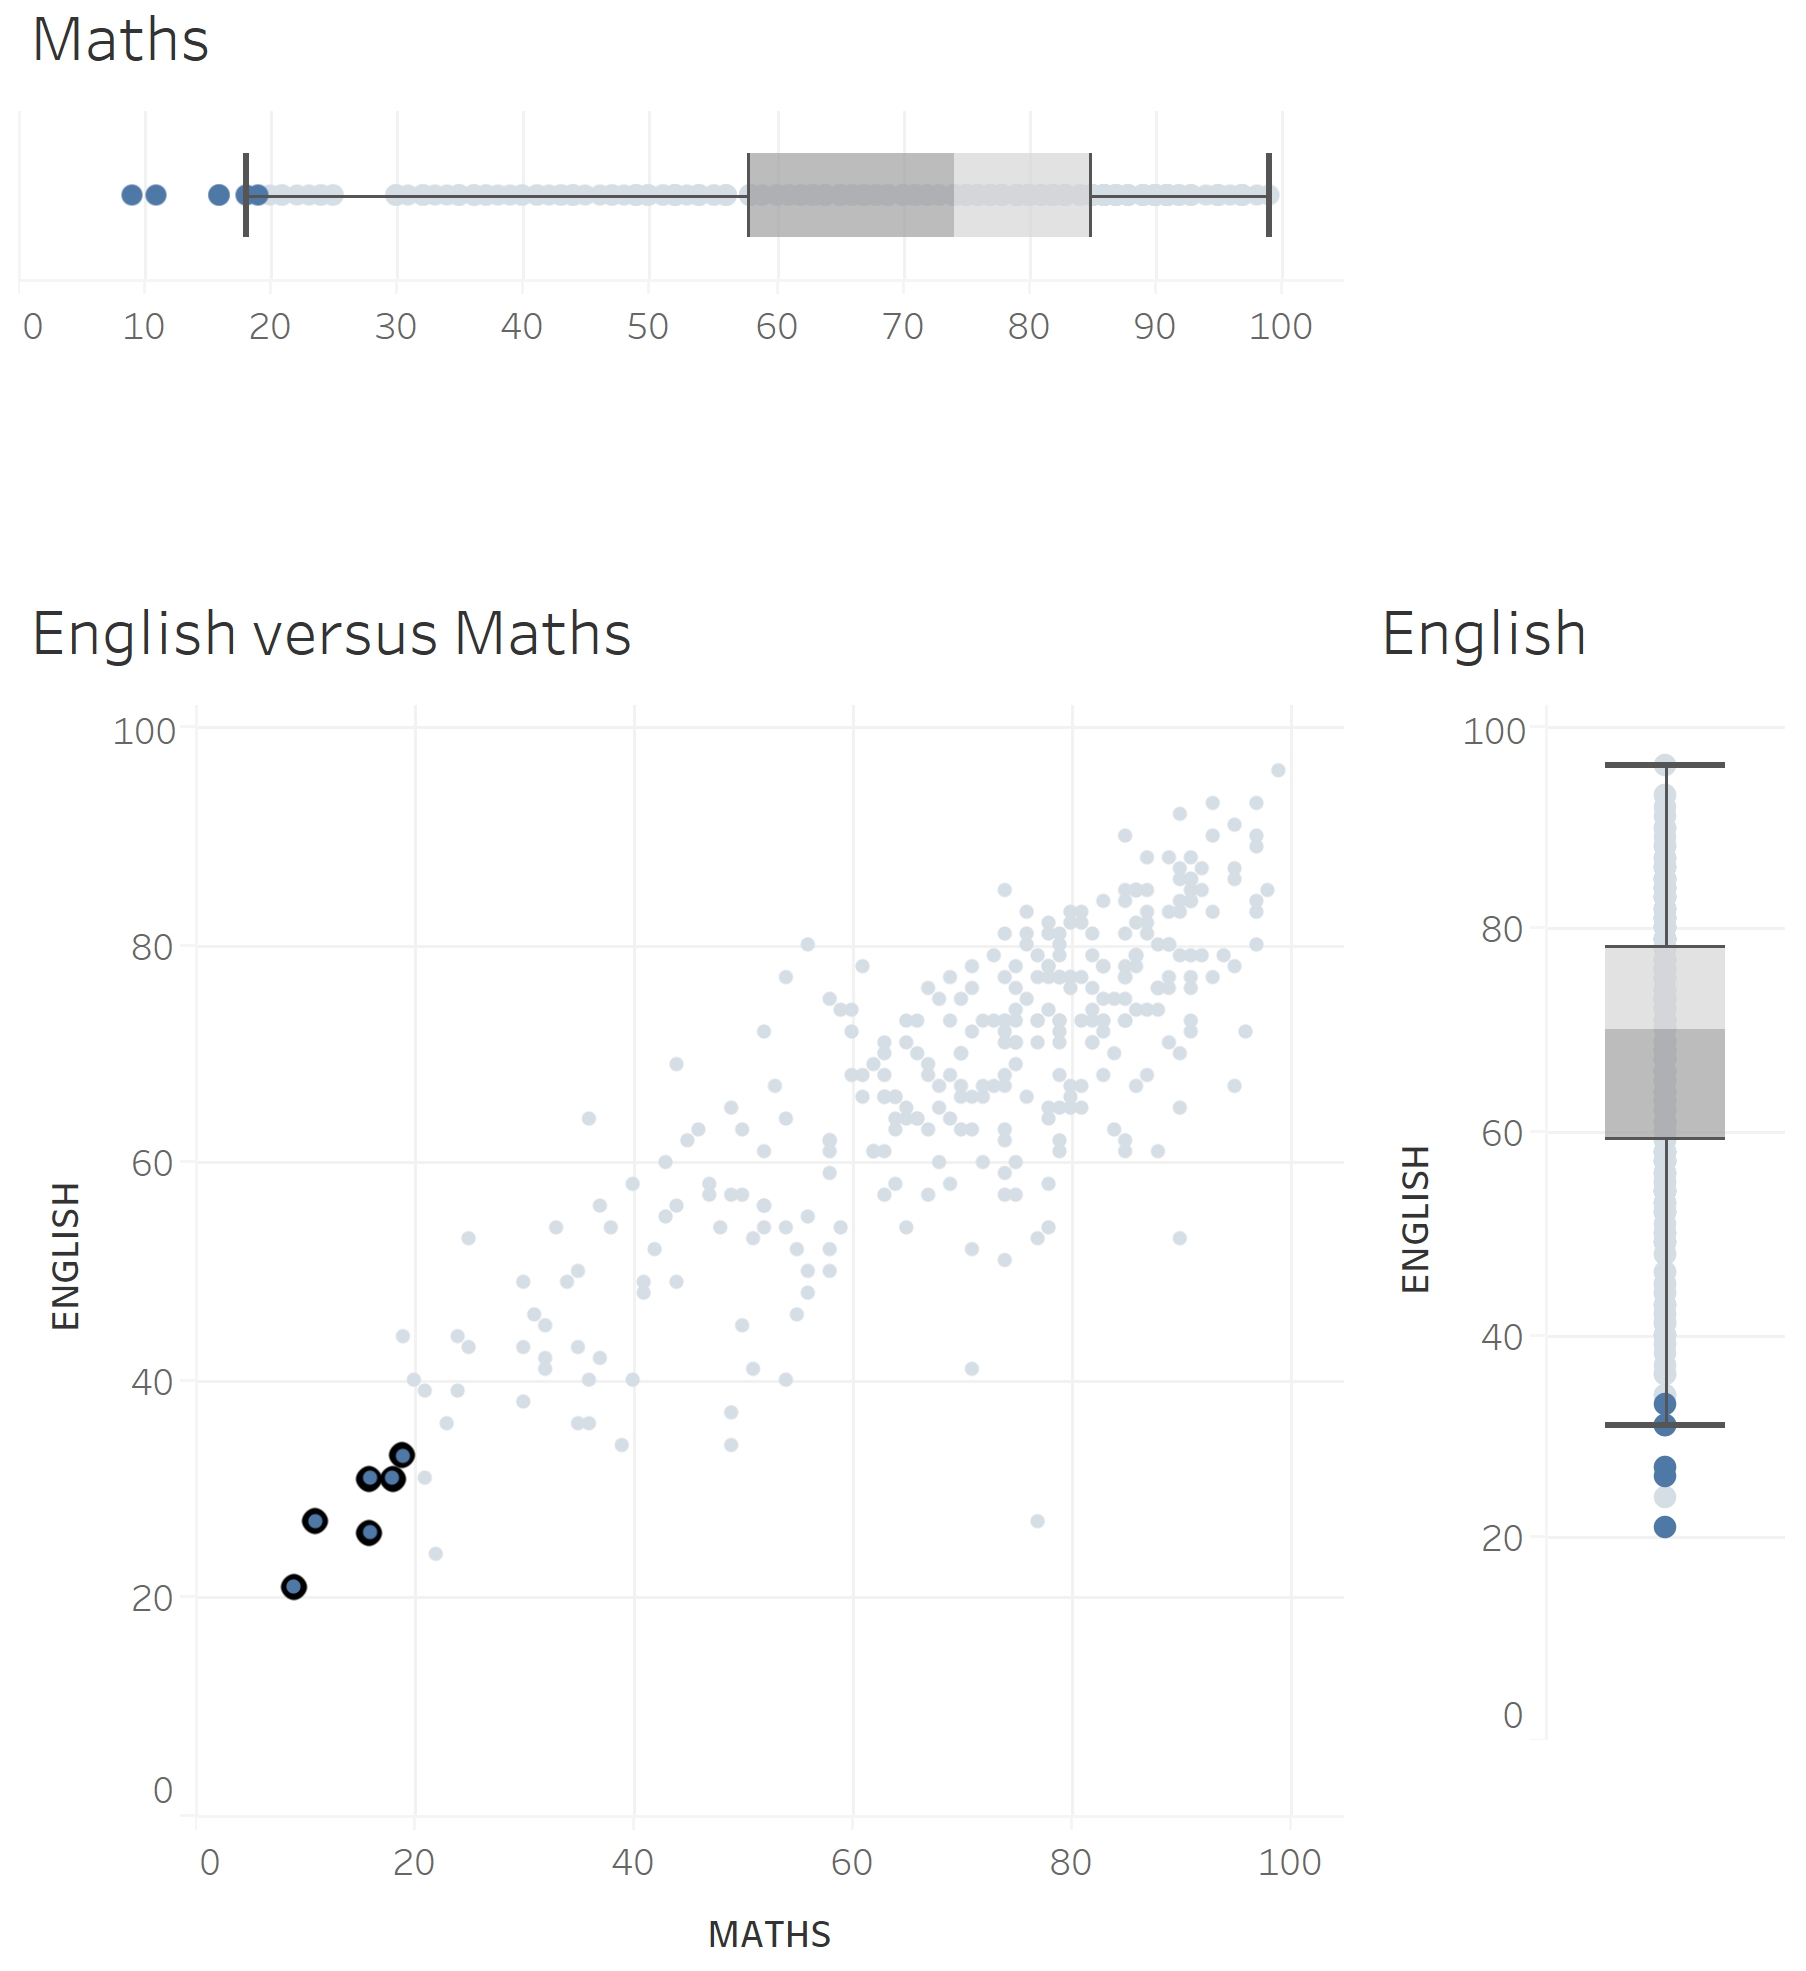 ] .center[ Scatterplot with marginal boxplot] --- ## View Manipulation - **Organise** multiple windows and workspaces .center[ 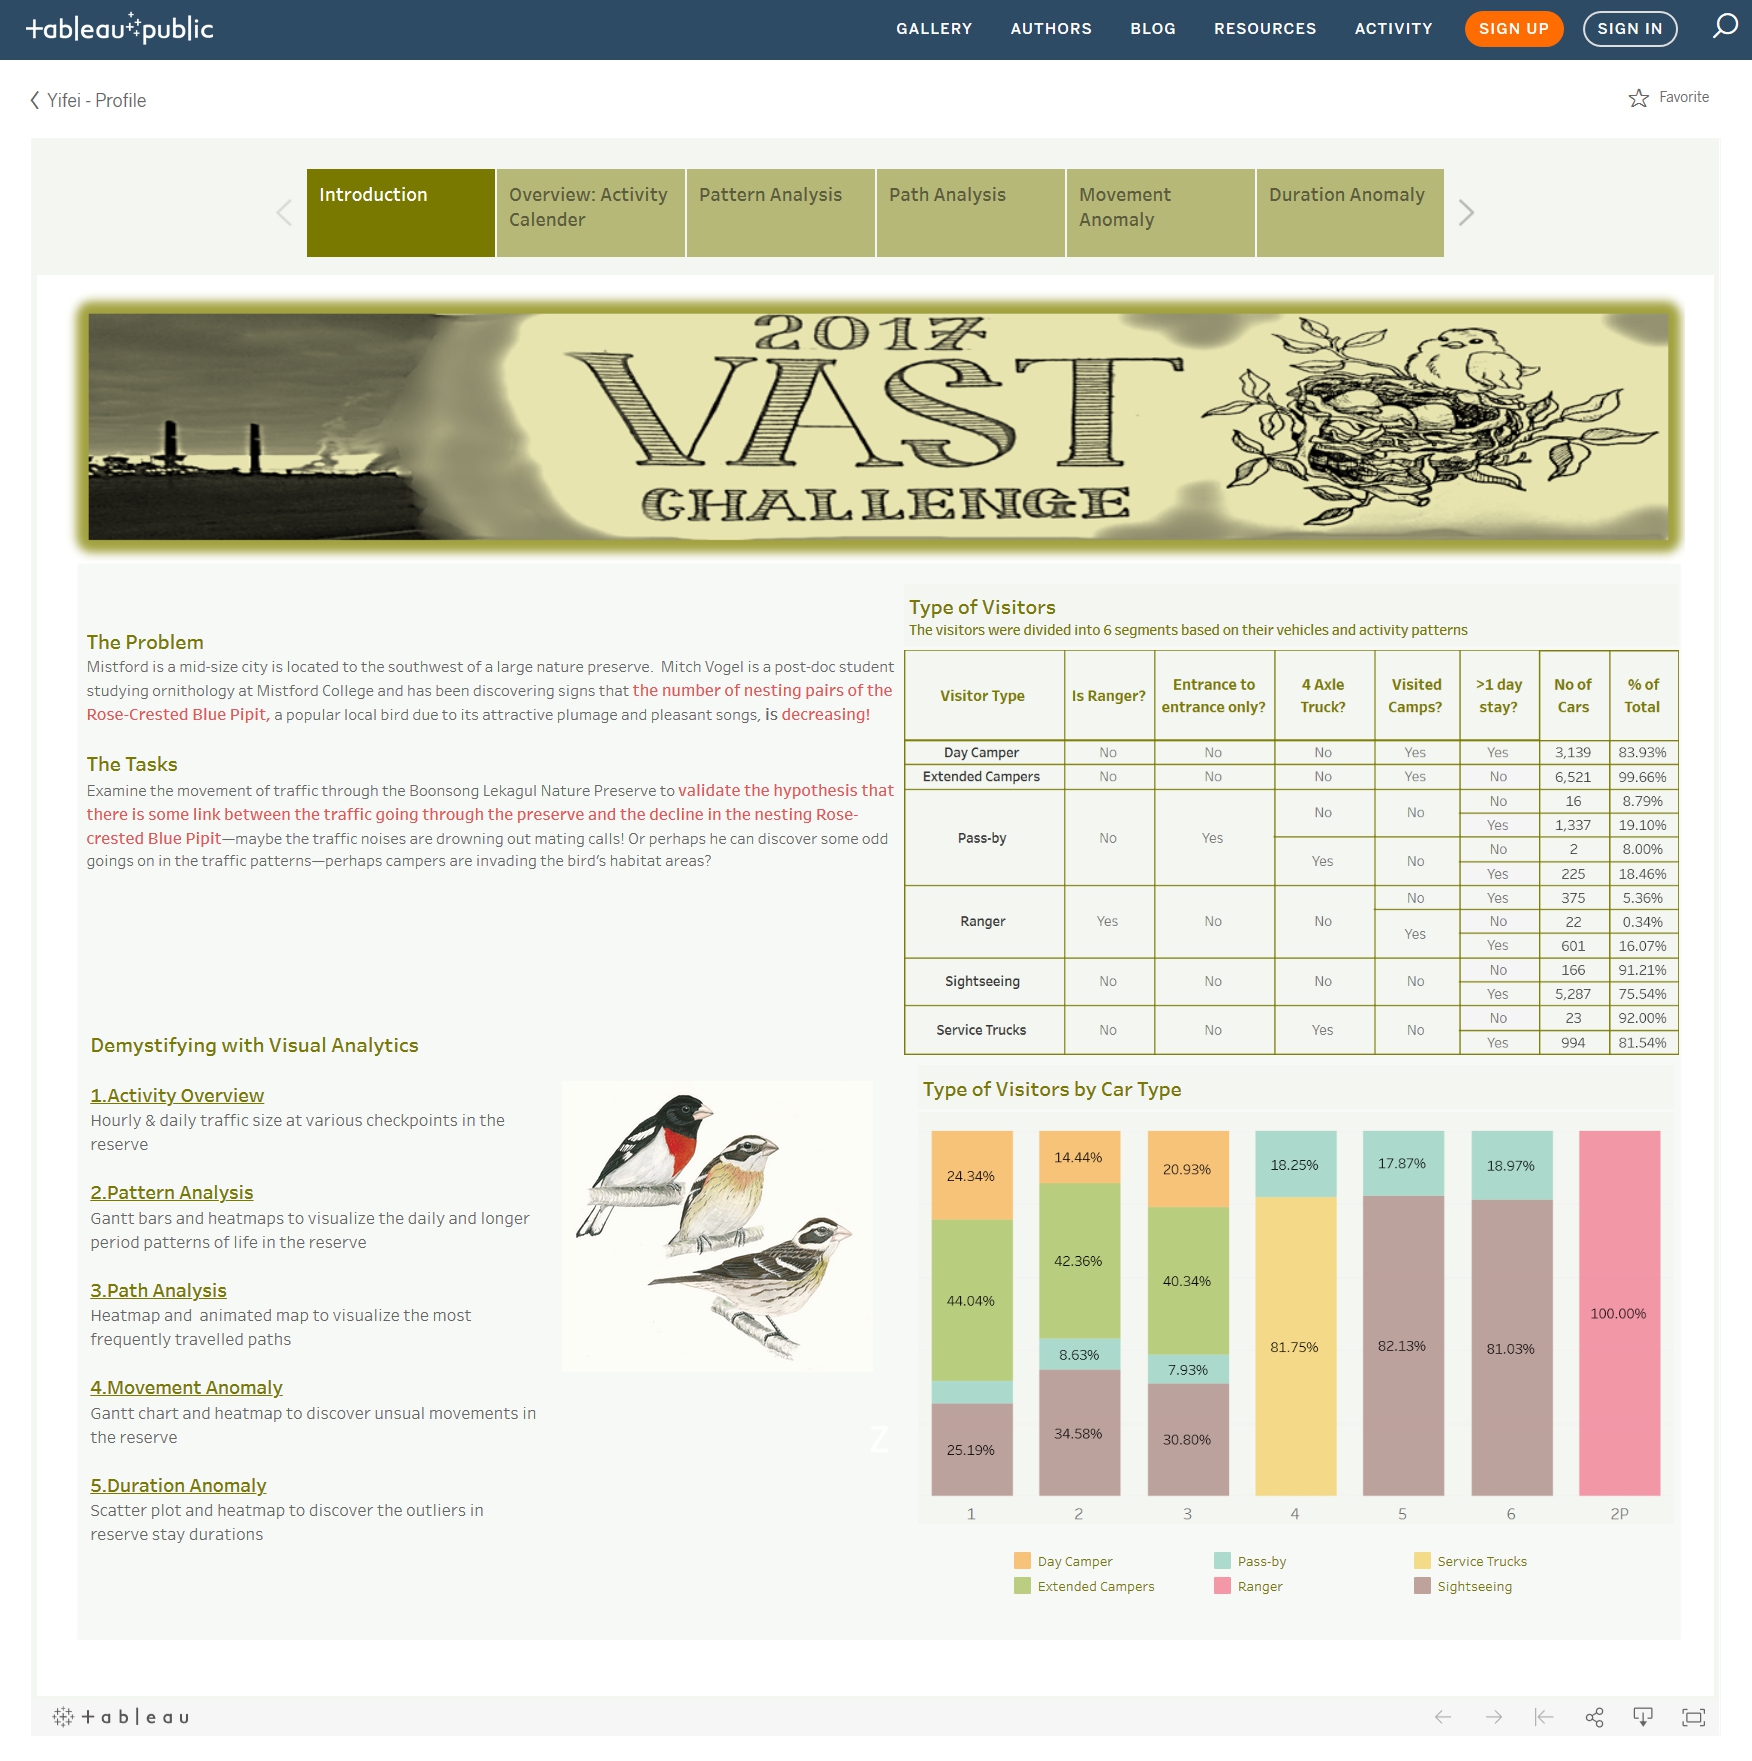] .small[ Source:https://public.tableau.com/profile/yifei2012#!/vizhome/Updated1/VASTChallenge2017MC1] --- ## View Manipulation ### Rotating - Touring view with JMP’s 3D scatterplot .center[ 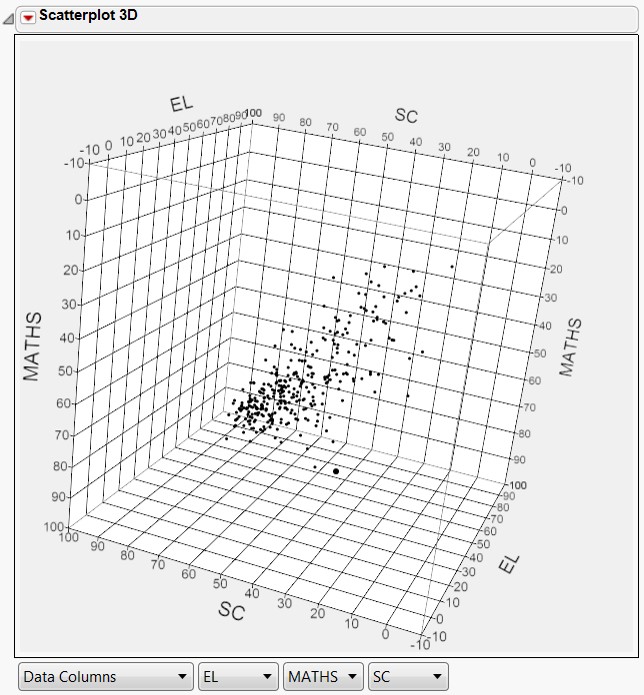] --- ## Process and Provenance .large[ - **Record** analysis histories for revisitation, review and sharing. - **Annotate** patterns to determine findings. - **Share** views and annotations to enable collaboration. - **Guide** users through analysis tasks or stories. ] ??? Visual analytics is not limited to the generation and manipulation of visualizations—it involves a process of iterative data exploration and interpretation. As a result, visual analytics tools that provide facilities for scaffolding the analysis process will be more widely adopted. Tools should preserve analytic provenance by keeping a record of analyst actions and insights so that the history of work can be reviewed and refined. --- ## Interactive Design Primitive A framework for effective interactive design in visual analytics application. .center[ 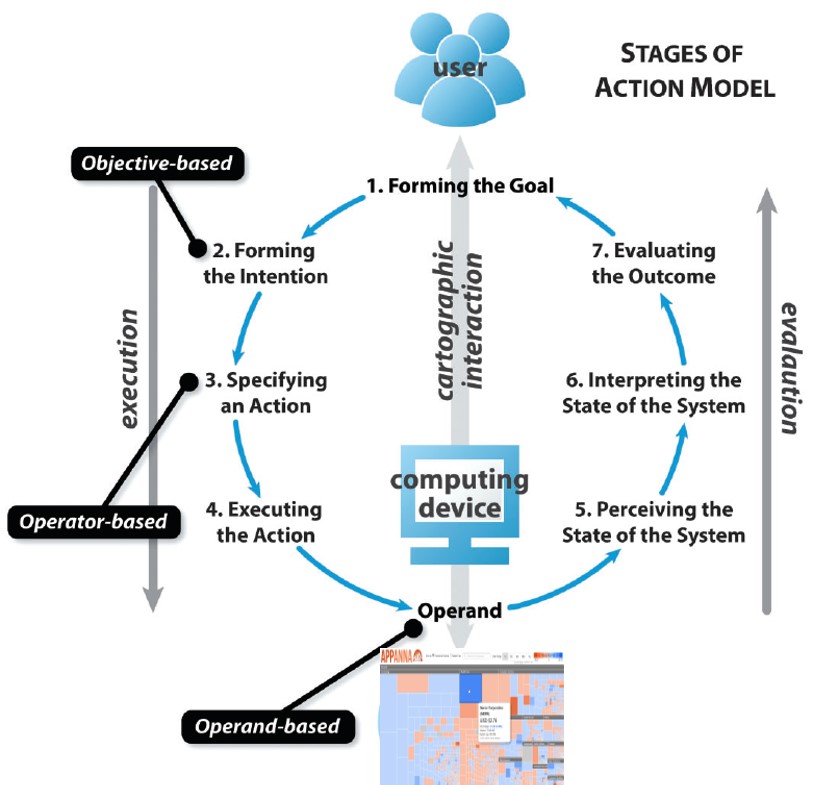 ] .small[ Source: Roth, R.E. (2012) “Cartographic Interaction Primitive: Framework and Synthesis”. The Cartographic Journal, Vol. 49, No. 4 pp. 376-395. ] --- ## Interactive Design Primitive .pull-left[ ### Visual Analytics Objective Primitives 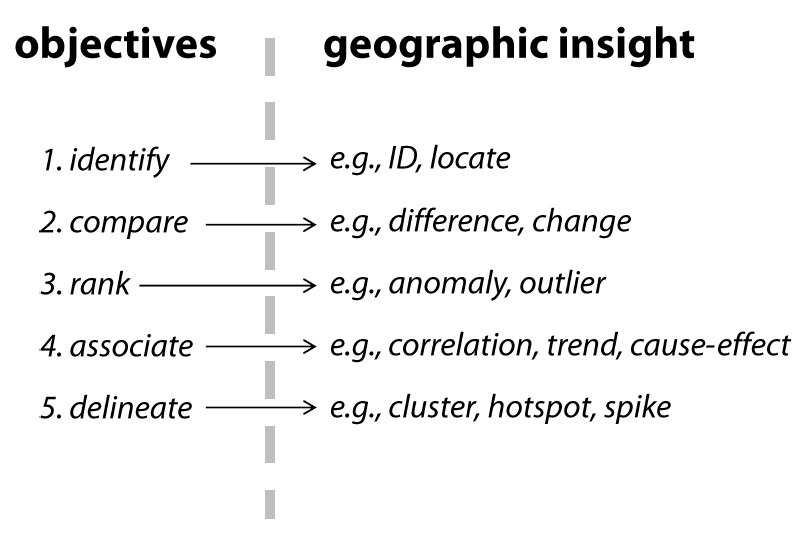 ] .pull-right[ ### Interactive Analytics Operator Primitives 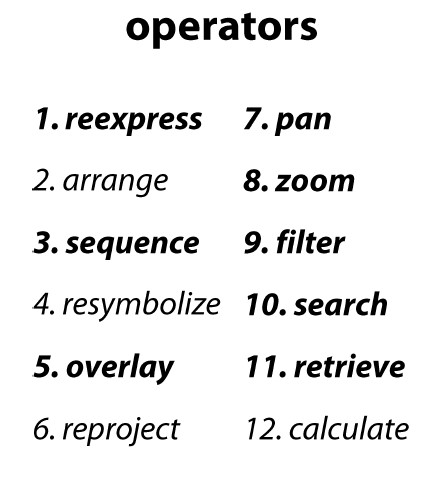 ] --- ## Interactive Design Primitive .center[ 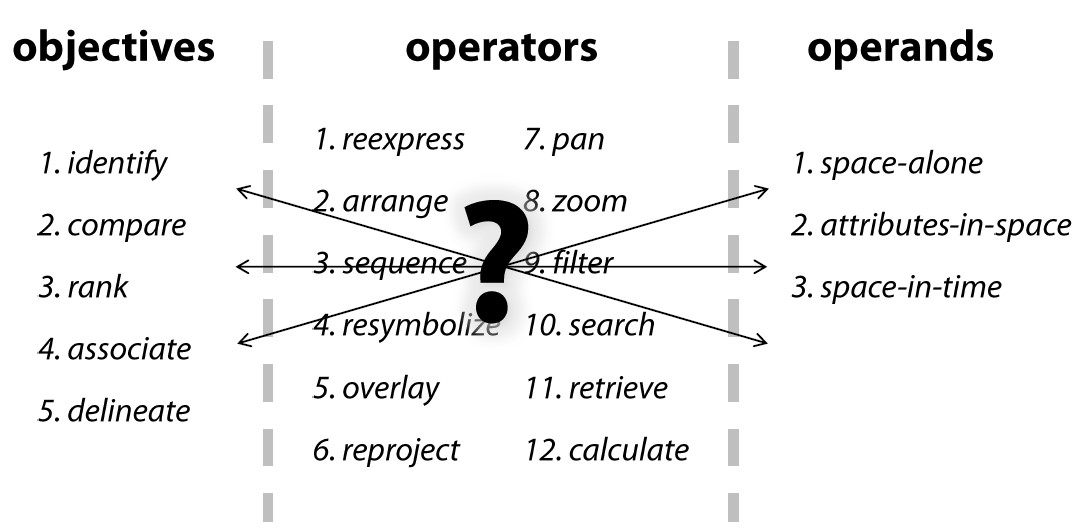 ] --- ## Animation in Visual Analytics .pull-left[ .large[ - The purpose of animation is to facilitate perception of changes when transitioning between related data graphics - Do not confine to time-series data only ] ] .pull-right[  .small[Source: http://worrydream.com/HowManyHouseholds/] ] --- ### Why using Animation in Visual Analytics .large[ - Motion is highly effective at attracting attention. - Animation facilitates object constancy for changing objects. - Animated behaviours can give rise to perceptions of causality and intentionality, communicating cause-and-effect relationships and establishing narrative. - Animation can be emotionally engaging, engendering increased interest or enjoyment. ] --- ### Principles of Animation .pull-left[ - ***Congruence*** principle states that the structure and content of the external representation should correspond to the desired and content of the internal representation. - Maintain valid data graphics during transitions - Use consistent semantic-syntactic mappings - Respect semantic correspondence - Avoid ambiguity ] .pull-right[ - ***Apprehension*** principle states that the structure and content of the external representation should be readily and accurately perceived and comprehended. - Group similar transitions - Minimise occlusion - Maximise predictability - Use simple transitions - Use staging for complex transitions - Make transitions as long as needed, but no longer ] .small[Source: Heer, J and Robertson G. (2007) [Animated Transitions in Statistical data Graphics](https://idl.cs.washington.edu/files/2007-AnimatedTransitions-InfoVis.pdf), IEEE Transactions on Visualization and Computer Graphics, Vol. 13, No. 6, 1240-1247 and the [video](https://www.youtube.com/watch?v=vLk7mlAtEXI). ] --- ## Animation in Action .pull-left[ ### Stacked-to-Grouped Bars  .small[Source: https://observablehq.com/@d3/stacked-to-grouped-bars ] ] .pull-right[ ### Animated Co-occurrence matrix  .small[Source: https://bost.ocks.org/mike/miserables/ ] ] --- ## References - [Dynamics for Visual Analysis](https://idl.cs.washington.edu/files/2012-InteractiveDynamics-CACM.pdf) - [Animated Transitions in Statistical Data Graphics](https://idl.cs.washington.edu/files/2007-AnimatedTransitions-InfoVis.pdf), IEEE Transactions on Visualization and Computer Graphics, Vol. 13, No. 6, 1240-1247 and the [video](https://www.youtube.com/watch?v=vLk7mlAtEXI) - [Coordinated Highlighting in Context](http://www.perceptualedge.com/articles/visual_business_intelligence/coordinated_highlighting_in_context.pdf) - [Cartographic Interaction Primitive: Framework and Synthesis](https://web-a-ebscohost-com.libproxy.smu.edu.sg/ehost/pdfviewer/pdfviewer?vid=1&sid=16eab3bc-b4a2-47b5-9a03-2619822e5ddb%40sessionmgr4007)